In this article
- Striking growth figures in Hageland
- Data as a signal: when figures call for action
- Visual inspection: the indispensable link
- General growth in week 30
- Learning from the field: technology and practical knowledge
- The importance of reliable data for the grower
- WolkyTolky: your partner in precision agriculture
Pear growing is a trade of precision. Every millimetre of growth counts, especially in a season when the weather is unpredictable and the market demands top quality. With WolkyTolky dendrometers we measure the growth of pears daily in five leading fruit regions in the Netherlands and Belgium: North Holland, Betuwe, Zeeland, Hageland and Haspengouw. This data gives growers insight into current growth, and also makes it possible to compare regions with each other and step in quickly when something deviates.
Striking growth figures in Hageland
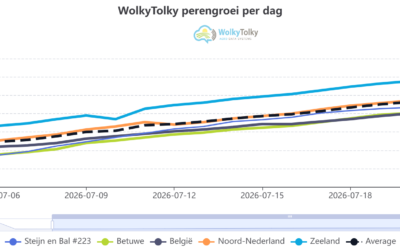
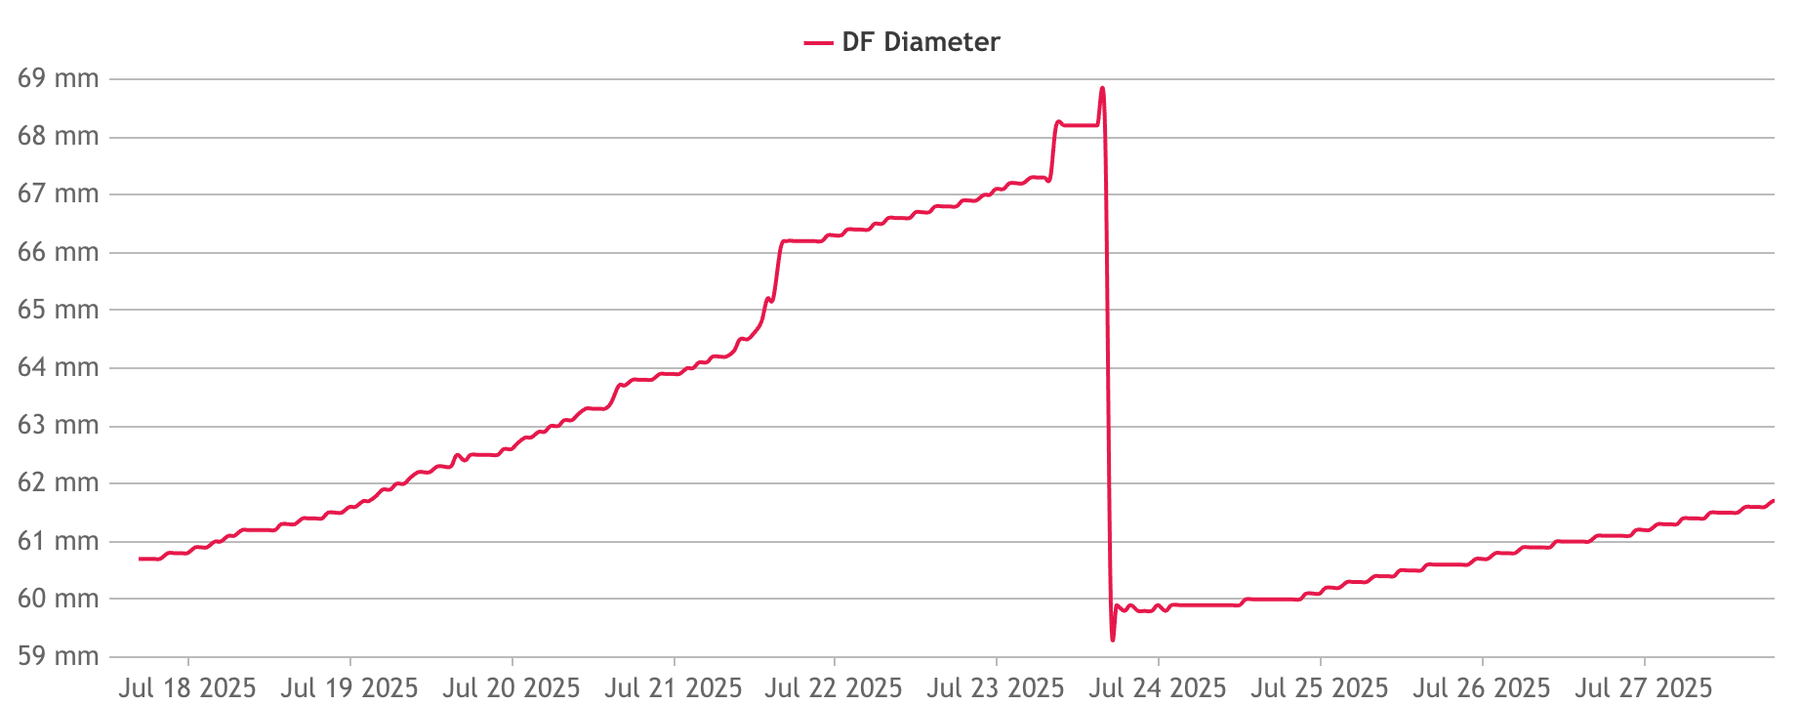
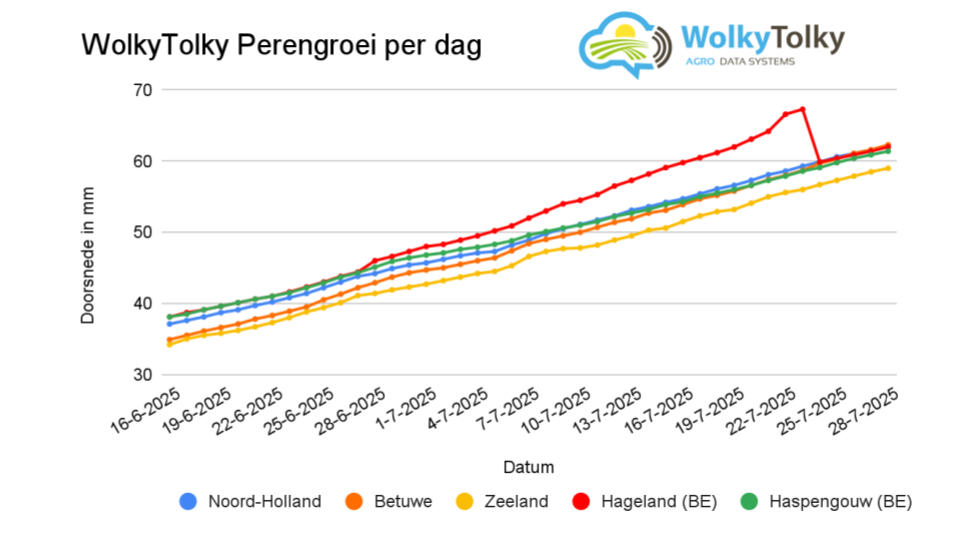
In recent weeks we noticed something unusual in the data from Hageland. While growth in the other regions was steady and predictable, in Hageland we saw an ever faster increase in pear diameter. At first it looked like a good sign: the pears there were growing faster than elsewhere. But as the days went by, the growth drifted further and further out of step with the other regions. Where fellow growers in the Netherlands and Belgium saw growth of around 3.5 to 4.2 mm a week, Hageland shot up with values that were simply no longer realistic.
Data as a signal: when figures call for action
This is exactly where the strength of continuous monitoring and regional comparison shows. Thanks to the WolkyTolky systems, we saw straight away that something was wrong. The data acted as an alarm signal: why is the pear in Hageland growing so much faster? Is there a unique microclimate, a different soil, or… is something else going on?
Visual inspection: the indispensable link
Because the figures deviated so strikingly, we decided to carry out a visual inspection at the sensor in Hageland. And there the cause quickly became clear: a small twig had ended up between the sensor and the pear. This twig grew along with the pear, so the sensor registered an ever larger diameter than was actually the case. The result: an artificially high growth curve that did not match reality.
After the twig was removed, we saw straight away that the growth figures were back within the range of the other regions. The measurement error was solved, and the data was reliable again.
General growth in week 30
The week 30 growth figures show that the pears in North Holland, Betuwe, Zeeland and Haspengouw all grew between 3.5 and 4.2 mm. This is healthy, steady growth for this stage of the season. It underlines that conditions in these regions are favourable for even fruit development. Thanks to continuous monitoring with WolkyTolky, growers can follow this growth closely and respond in time to any deviations.
Learning from the field: technology and practical knowledge
This practical example shows how important it is to combine technology and practical knowledge. WolkyTolky gives growers the ability to monitor their crops 24/7, spot deviations quickly and take targeted action. But it also shows that a regular visual check in the field remains indispensable. A sensor is only as smart as the environment it is placed in – and sometimes a simple field inspection is the key to reliable data.
The importance of reliable data for the grower
Reliable growth data is essential for making the right growing decisions. It helps determine the optimal harvest moment, estimate yield and spot stress factors such as drought or disease in time. But as this example from Hageland shows, it is also important to stay alert to possible measurement errors. By taking deviations in the data seriously and checking quickly in the field, you avoid wrong conclusions and can steer on data with confidence.
WolkyTolky: your partner in precision agriculture
With WolkyTolky you are assured of current, reliable and immediately usable data. Our systems are easy to install, give insight remotely and make it possible to respond quickly to changes in the crop. And thanks to the regional comparison, you see at a glance whether your pears are in step with other growers – or whether there is reason to take a closer look.
Want to know more about how WolkyTolky can support your growing? Or are you curious about the possibilities of our dendrometers and other sensors? Feel free to get in touch.
Together we make pear growing smart, reliable and profitable!