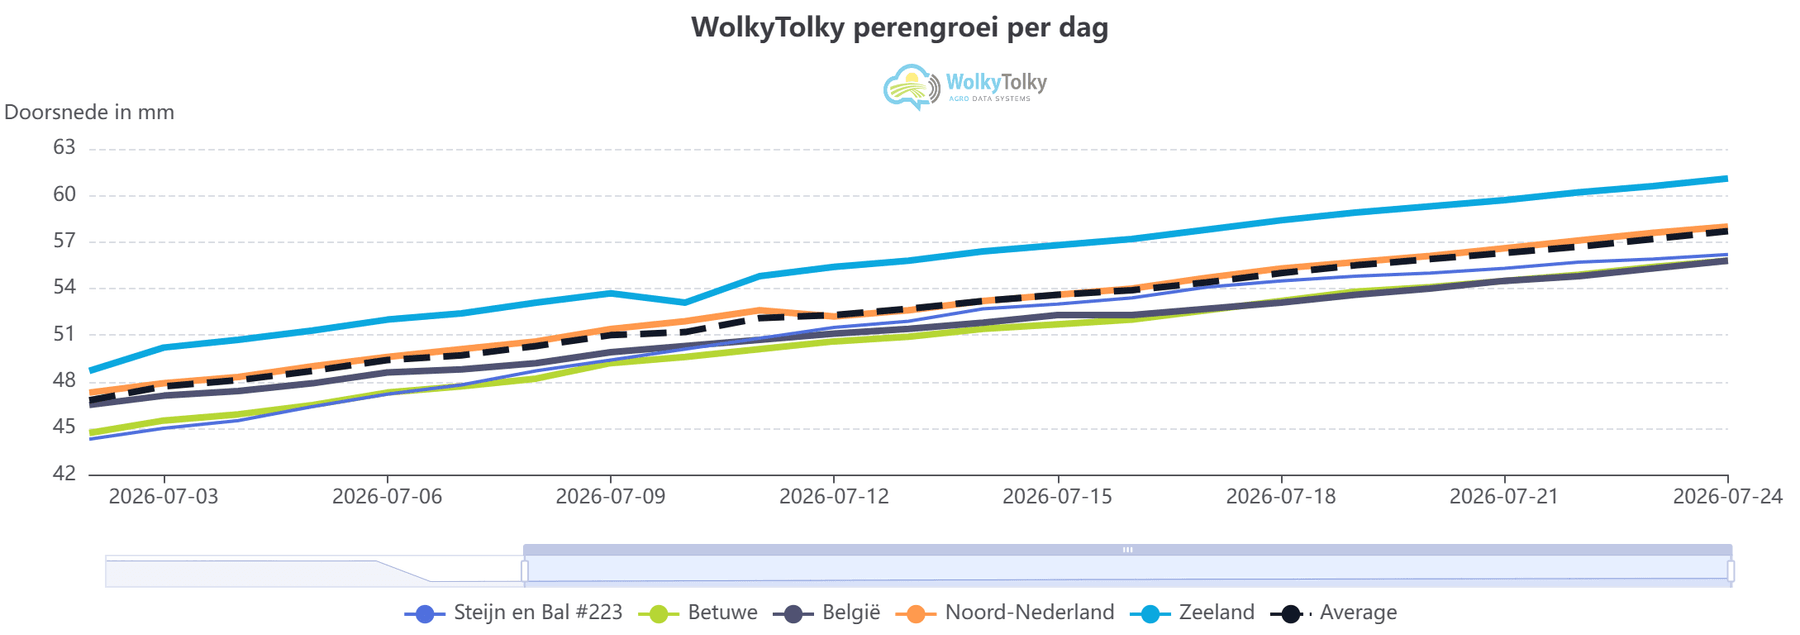
This week the pears keep growing steadily in all measured areas. Between 17 and 24 July, the average fruit size increased by 3.1 to 3.3 mm. That comes to about 0.44 to 0.47 mm of growth per day.
The figures in a row:
-
Northern Netherlands: +3.3 mm → 58.0 mm
-
Betuwe: +3.2 mm → 55.8 mm
-
Belgium: +3.1 mm → 55.8 mm
-
Zeeland: +3.3 mm → 61.1 mm
Zeeland thus stays in the lead in absolute fruit size. Notably, weekly growth is now converging much more: the northern Netherlands grew on average just as fast as Zeeland this week.
The best regional growth days came out at +0.6 mm in a single day. The weakest growth days were around +0.3 mm. There was no shrinkage in the regional averages: the pears kept growing daily in all areas.
Looking at the individual measuring points, we see much bigger differences. The strongest individual grower this week was in Zeeland: +4.9 mm in seven days, or an average of 0.70 mm per day. The best-growing individual measuring point in Belgium came out at +4.5 mm. In the northern Netherlands it was +3.6 mm and in the Betuwe +3.2 mm.
It is exactly those differences that make individual measurements interesting. A regional average tells you roughly how growth is developing, but at plot level, growth curves can differ considerably.
Zooming in on Zeeland: growth and soil moisture
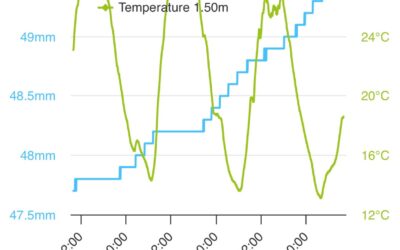
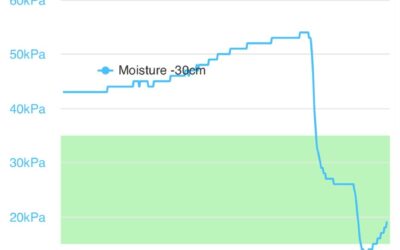
On a Zeeland plot with drip irrigation, we follow not only fruit diameter but also soil moisture at two depths.
From 17 to 23 July, the measured pear grew 1.7 mm: an average of 0.28 mm per day. That is lower than the regional growth in Zeeland over the same period: 2.8 mm, or 0.47 mm per day.
The moisture measurements show that there is movement and replenishment in the soil profile. But the fruit diameter curve shows at the same time that enough moisture in the soil doesn’t automatically mean fruit growth speeds up right away.
That is exactly the strength of the combination:
Soil moisture shows what is available to the tree.
The dendrometer shows what the fruit is actually doing.
Without fruit diameter measurement, we would only see that there is moisture in the profile. Without soil moisture measurement, we would see that growth levels off, but couldn’t judge whether water availability might play a part.
Same Zeeland station, same period, last year
A comparison with last year makes it even more interesting. We compare the same station over the same calendar period: 1 to 23 July.
| Same station, 1–23 July | 2025 | 2026 |
|---|---|---|
| Start size | 42.8 mm | 44.0 mm |
| End size | 56.4 mm | 56.1 mm |
| Total growth | +13.6 mm | +12.1 mm |
| Average growth per day | 0.62 mm/day | 0.55 mm/day |
So the pear started 1.2 mm larger this year than last year. Yet the size measured on 23 July ended up 0.3 mm lower.
The explanation lies in the growth rate: over the same calendar period, the pear grew on average 11% slower per day this year than last year.
That difference arose mainly from mid-July. Up to and including 13 July, cumulative growth this year was even ahead of last year. After that, the 2026 growth curve levelled off, while last year it actually sped up further.
We don’t know the number of growing days after full bloom for 2025, so it isn’t a completely clean seasonal comparison. But in relative terms, the same calendar period does show something important:
A good start is no guarantee of a lasting high growth rate. It is precisely by following growth, soil moisture and weather conditions together that it becomes visible when a plot changes course.
#perenteelt #fruitteelt #precisielandbouw #metenisweten #pratenmetdeplanten