In this article
Pear growth week 29 – the heat wave is over
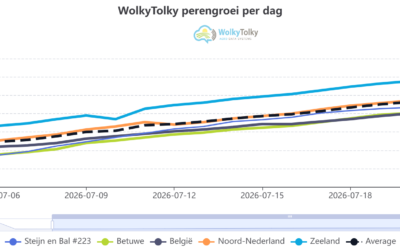
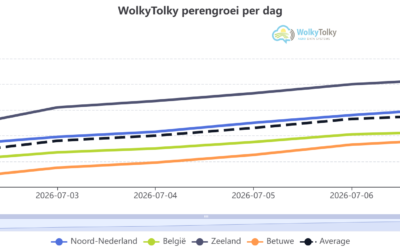
As is almost customary, this week we are back with a pear growth update for the 5 regions where more and more measuring has been going on since this year.
Last week Jan Peeters rightly pointed out that a regional comparison says more when we also look at the number of days after full bloom:
“Nice data, but it becomes clearly more meaningful if you talk about days after full bloom. Then the comparison is more realistic.”
We are including that addition this week. Regional differences remain interesting and visible, but a pear that flowered earlier has also had more days to grow. By relating fruit size to the number of days after full bloom, we compare the regions more fairly.
The situation on 18 July: size in relation to growing age
| Region | Measured size on 18 July | Days after full bloom | Size per growing day |
|---|---|---|---|
| Northern Netherlands | 55.25 mm | 92 | 0.60 mm/day |
| Betuwe | 53.20 mm | 98 | 0.54 mm/day |
| Zeeland | 58.40 mm | 100 | 0.58 mm/day |
| Hageland | 51.93 mm | 105 | 0.49 mm/day |
| Haspengouw | 51.97 mm | 105 | 0.49 mm/day |
The largest absolute size on 18 July is in Zeeland, at 58.40 mm. The northern Netherlands follows with 55.25 mm.
Looking at size in relation to the number of growing days after full bloom, the northern Netherlands comes first with an average of 0.60 mm per growing day. Zeeland follows with 0.58 mm per growing day. Hageland and Haspengouw are both at a rounded 0.49 mm per growing day.
This is not a prediction of final fruit size, nor a judgement on individual plots. It is a way to compare the current regional situation, corrected for the fact that bloom did not take place on the same date everywhere. It gets interesting when you start comparing individual plots with the average. Benchmarking, a form of “copying from the neighbours”, to learn faster which levers we do have to pull and so make the fruit grow more steadily.
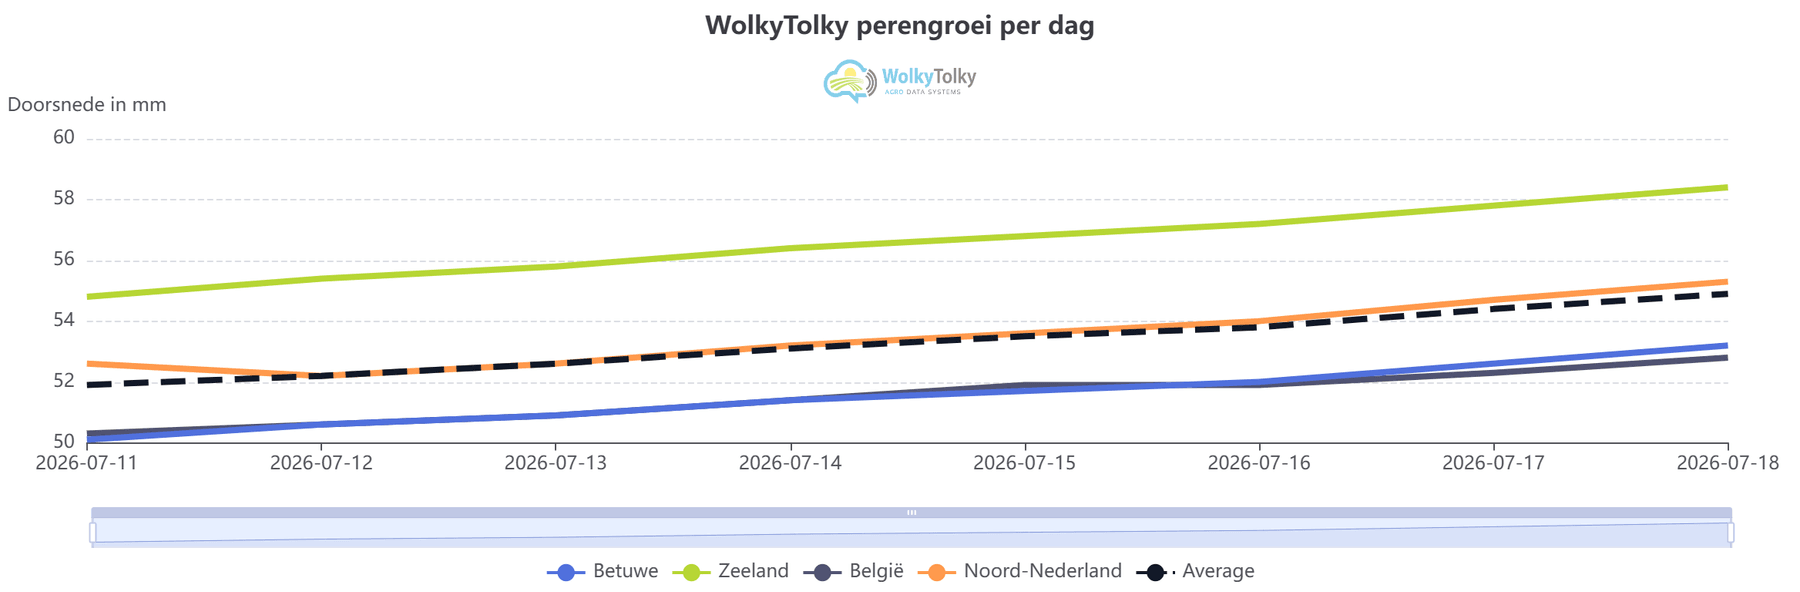
Focus on the last seven days
Over the past week too, growth is visible in all regions. In the regional data we see an average increase of about 2.7 mm in seven days.
-
Strongest grower: Northern Netherlands
-
Weakest grower: the Belgian regions sit lower on the regional growth curve than Northern Netherlands, Betuwe and Zeeland this week.
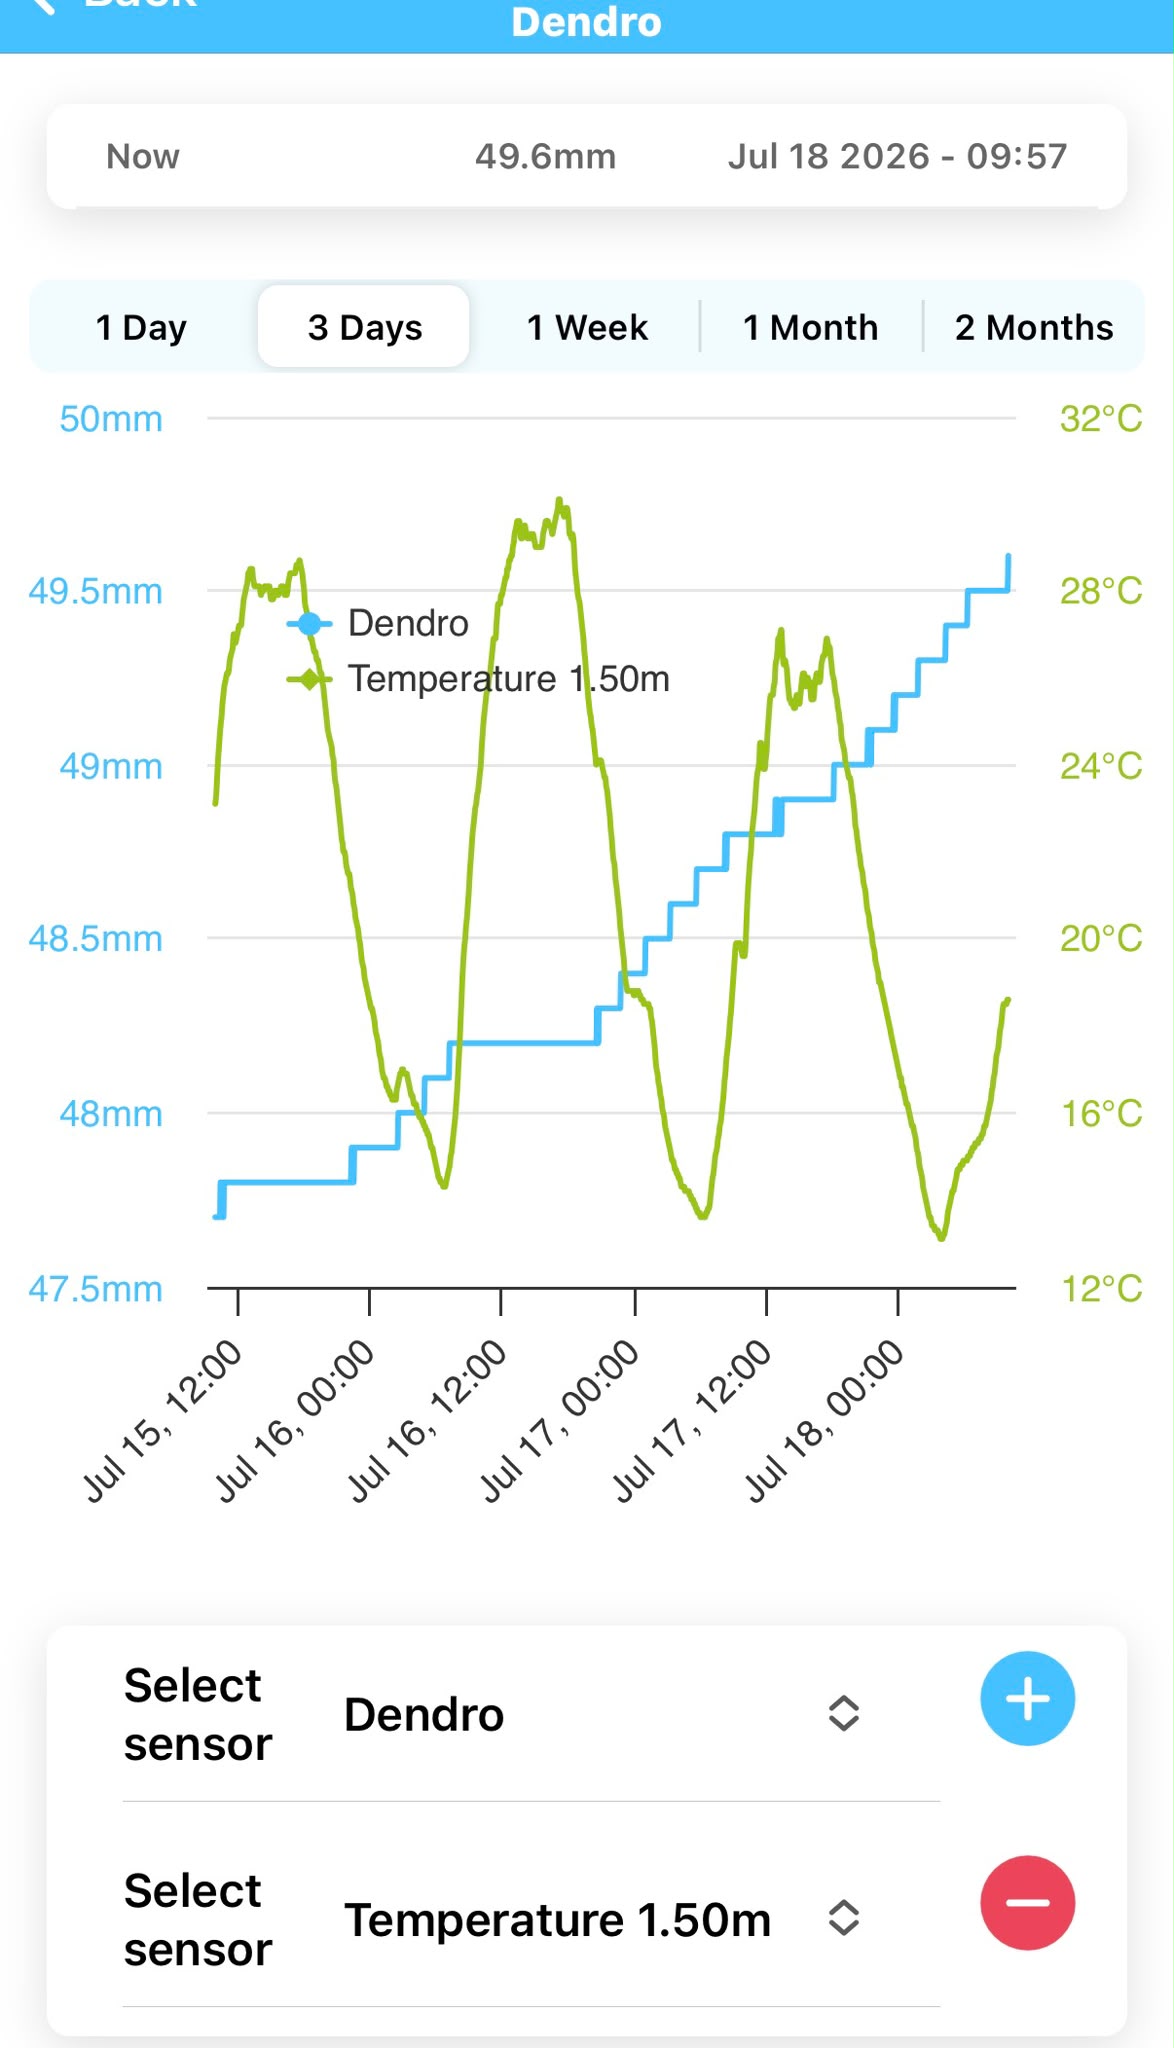
Weekly growth doesn’t tell the whole story, though. It is the detailed dendrometer trace that shows whether the pear only recovers at night, shrinks temporarily during the day or keeps growing almost without interruption.
Belgium: growth that runs almost all day at lower temperatures
The Belgian detail graph over three days shows a striking pattern. The temperature clearly rises during the day and drops back at night, but the dendrometer line keeps climbing in small steps.
Normally a fruit can shrink slightly for a while during the warm hours. Through evaporation, the tree then temporarily loses more water than is supplied directly to the fruit. In this graph we hardly see such a drop. The pear doesn’t only grow during the cooler night hours, but almost keeps growing during the day.
That is exactly the added value of continuous measurements: not just seeing that there is growth, but also seeing when that growth takes place.
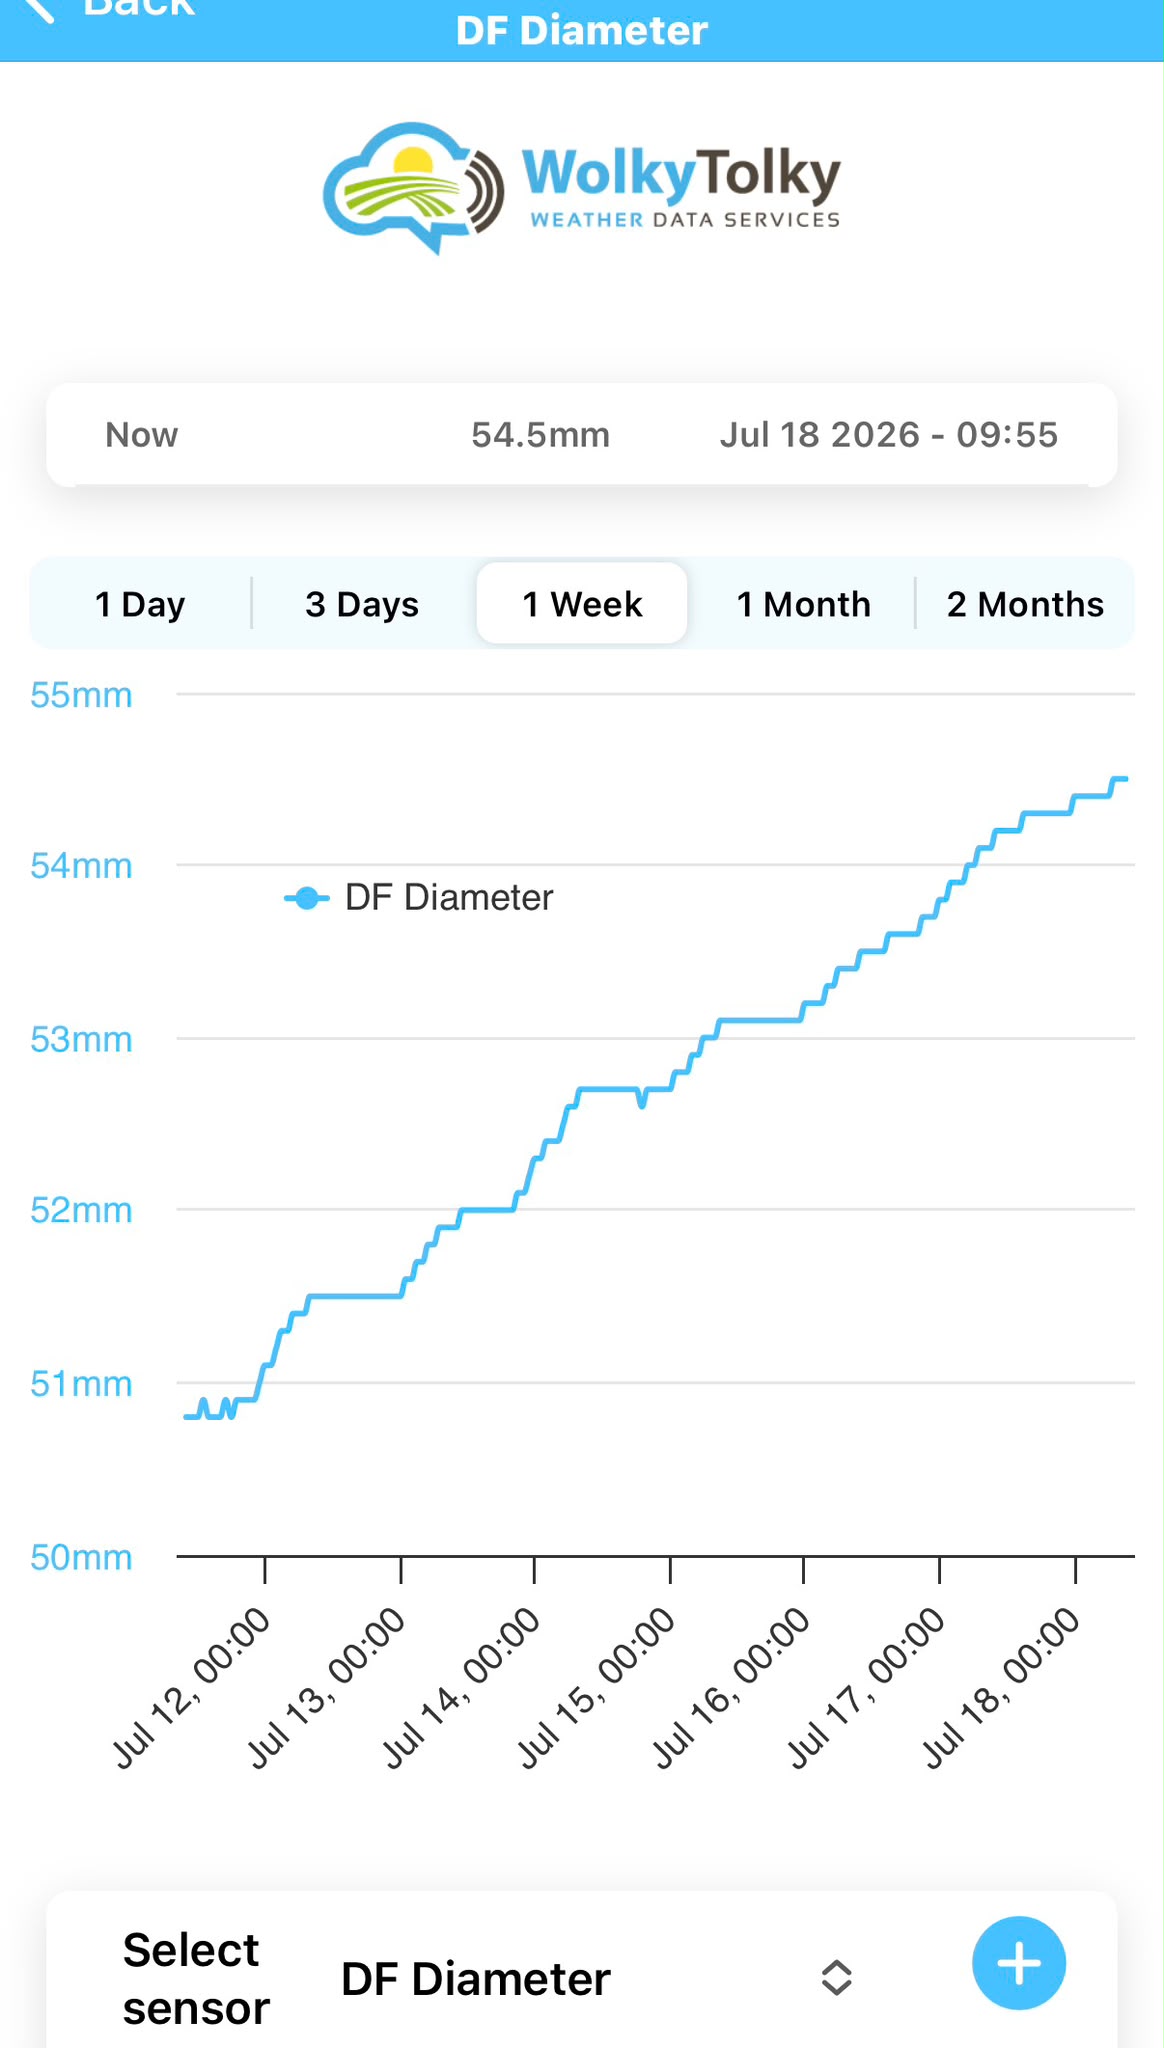
Zeeland: a week of steady growth
The Zeeland detail graph shows a fine, almost uninterrupted growth line over seven days. The measured diameter rises from about 50.8 mm to 54.5 mm.
At most there is a brief moment of slight decline. After that, growth picks straight up again. The picture is clear: no prolonged growth stall and no clear daily shrinkage, but a steady build-up of fruit size over the week.
What do we learn from this?
The regional comparison remains valuable: Zeeland currently has the largest average fruit size, while the northern Netherlands, corrected for the number of days after full bloom, shows the highest size per growing day.
At the same time, the real strength lies in the daily growth pattern. The detail graphs from Belgium and Zeeland show how differently growth can run:
-
in Belgium, at more moderate temperatures, we see a pear that keeps growing almost all day;
-
in Zeeland, we see a very even growth line over a full week.
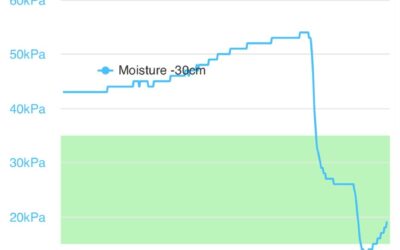
The next step is to link these growth curves further to soil moisture, temperature and water management. Then it becomes visible not only which region is growing, but also easier to explain why growth continues, levels off or temporarily stalls at certain moments. If it works out, next week we’ll dive a bit deeper into soil moisture and fruit growth.
#perengroei #perenteelt #fruitteelt #WolkyTolky #dendrometer #Zeeland #Hageland #Haspengouw #Betuwe #NoordNederland #precisielandbouw #bodemvocht #irrigatie