In this article
Not how much water is in your soil, but how much the plant can get
Soil can look moist while the plant still struggles to take up water. The other way round, soil can be a bit drier for a while without that being a problem straight away.
That is why water management is more than checking whether there is “still moisture” in the ground. The question is: how hard does the plant have to pull to take up water?
kPa: the effort a plant has to make
Watermark sensors measure in kPa. We call this soil water tension.
Put simply: the higher the kPa value, the more tightly the water is held in the soil and the more effort the plant has to make to get to it.
-
Towards 0 kPa: the soil is very wet. There is little air in the ground and little room to absorb rain.
-
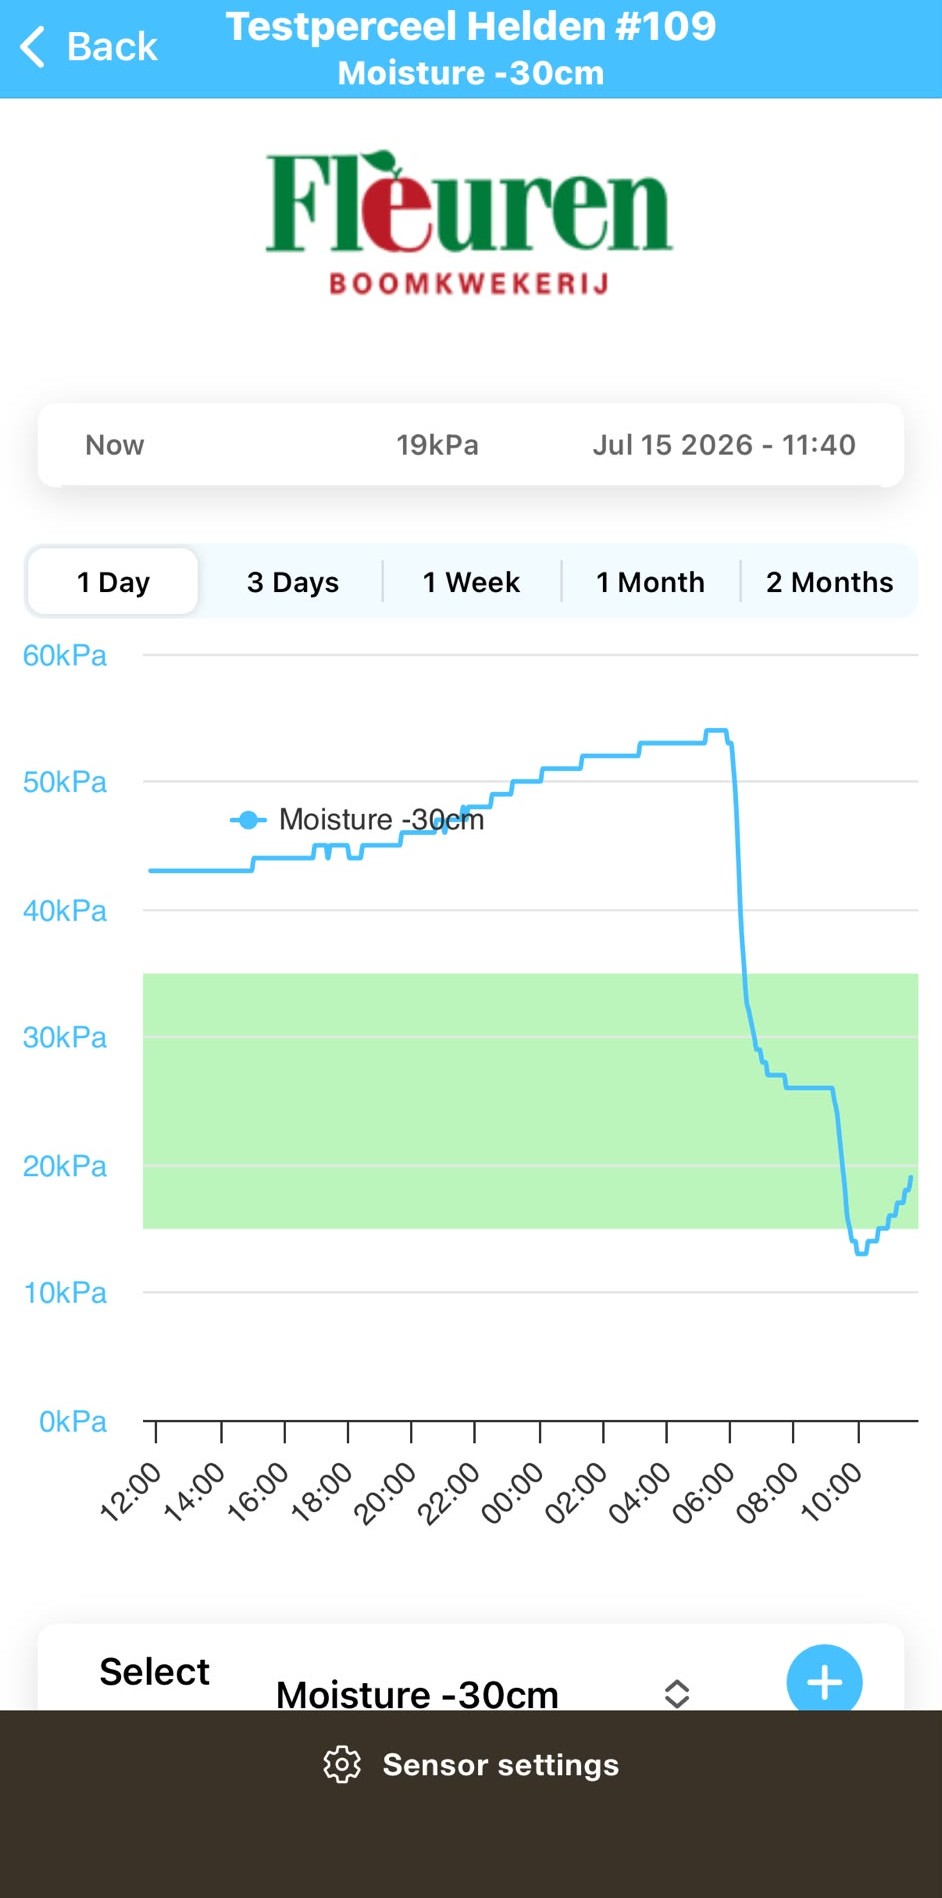
15–30 kPa: a workable zone for many crops.
-
Above 30 kPa: the plant has to pull harder. In many crops this can already cause growth loss.
In the WolkyTolky app the green band is set to 15–30 kPa by default. Use it as a starting point and adjust it where needed to plot, soil and crop.
What is a pF curve? Think of a sponge and a brick
A pF curve sounds complicated, but the idea is simple.
Say a sponge and a brick both contain water. You can squeeze the water out of the sponge easily. Out of the brick, hardly at all: the water is held much more tightly.
The same goes for soils. A sandy soil, clay soil or organic soil can have the same moisture percentage, but hold that water in a completely different way.
A pF curve is therefore the translation chart between:
-
how much moisture is in the soil;
-
how much effort the plant has to make to take up that moisture.
Without such a curve, a moisture percentage doesn’t tell you straight away whether the plant has enough available water.
Watermark or Teros: what exactly do you measure?
A Watermark directly measures the soil water tension in kPa. So you see how easy or hard it is for the plant to get water from the soil. That makes the values very usable and relatively comparable between plots. Watermarks are also affordable and last about five years on average.
Note: a Watermark doesn’t respond immediately after irrigation. The water first has to infiltrate and reach the sensor. So don’t look only at an alarm limit, but also at the trend in the graph.
A Teros sensor from METER Group measures the moisture percentage in the soil: VWC%. With it you can clearly see what an irrigation cycle does and how quickly a layer dries out. But without a pF curve you can’t simply compare those percentages between plots.
In short:
-
Watermark: how hard is it for the plant to get water?
-
Teros: how much water is in this soil layer?
Both are valuable, as long as you know what you are measuring.
Placement determines the quality of your data
A sensor in the wrong place doesn’t give insight, but noise.
In fruit growing we often place sensors at –30, –45 and –60 cm below ground level. Especially in older orchards we regularly see that much of the water is taken up from the layer at –45 cm. Once that layer has dried out, it takes a long time to get back to a good level after irrigation.
So don’t look only at the top sensor. It can respond quickly while the deeper root zone is still dry.
Do you see drought cracks in the plot? Then check the sensors too. A crack can leave a sensor loose from the soil. The measurement is then no longer reliable. Reinstall the sensor if the contact with the soil isn’t good.
Even better: prevent the profile from drying out so far that cracks form. Adjust in time, before the graph stays above the desired zone for long.
Act before growth is lost
Soil moisture data is not an end point. It is a signal to act in time.
So set your soil moisture alarms too. Go to Sensor settings > Push notifications and, for a Watermark, set the high alarm to 30 kPa, for example. That way you get a notification when the threshold you set is exceeded — and you can act before drought stress becomes visible in the crop.