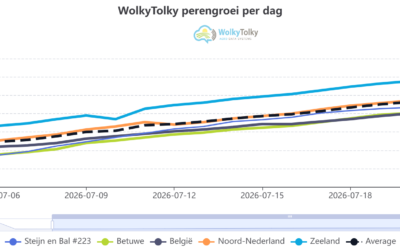
The pear harvest has begun, and with it our measuring season comes to an end. For four months, our dendrometers linked to WolkyTolky kept an eye on Conference growth every day. Five regions, five lines, one story: this year again we clearly saw how weather, soil conditions and ultimately the biology of the tree determine when growth stops.
📊Levelling off in the final weeks
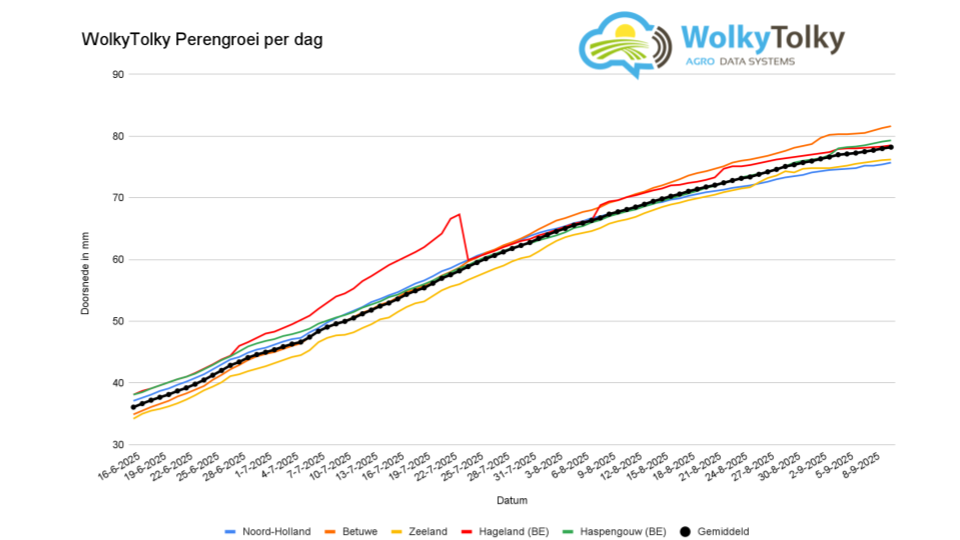
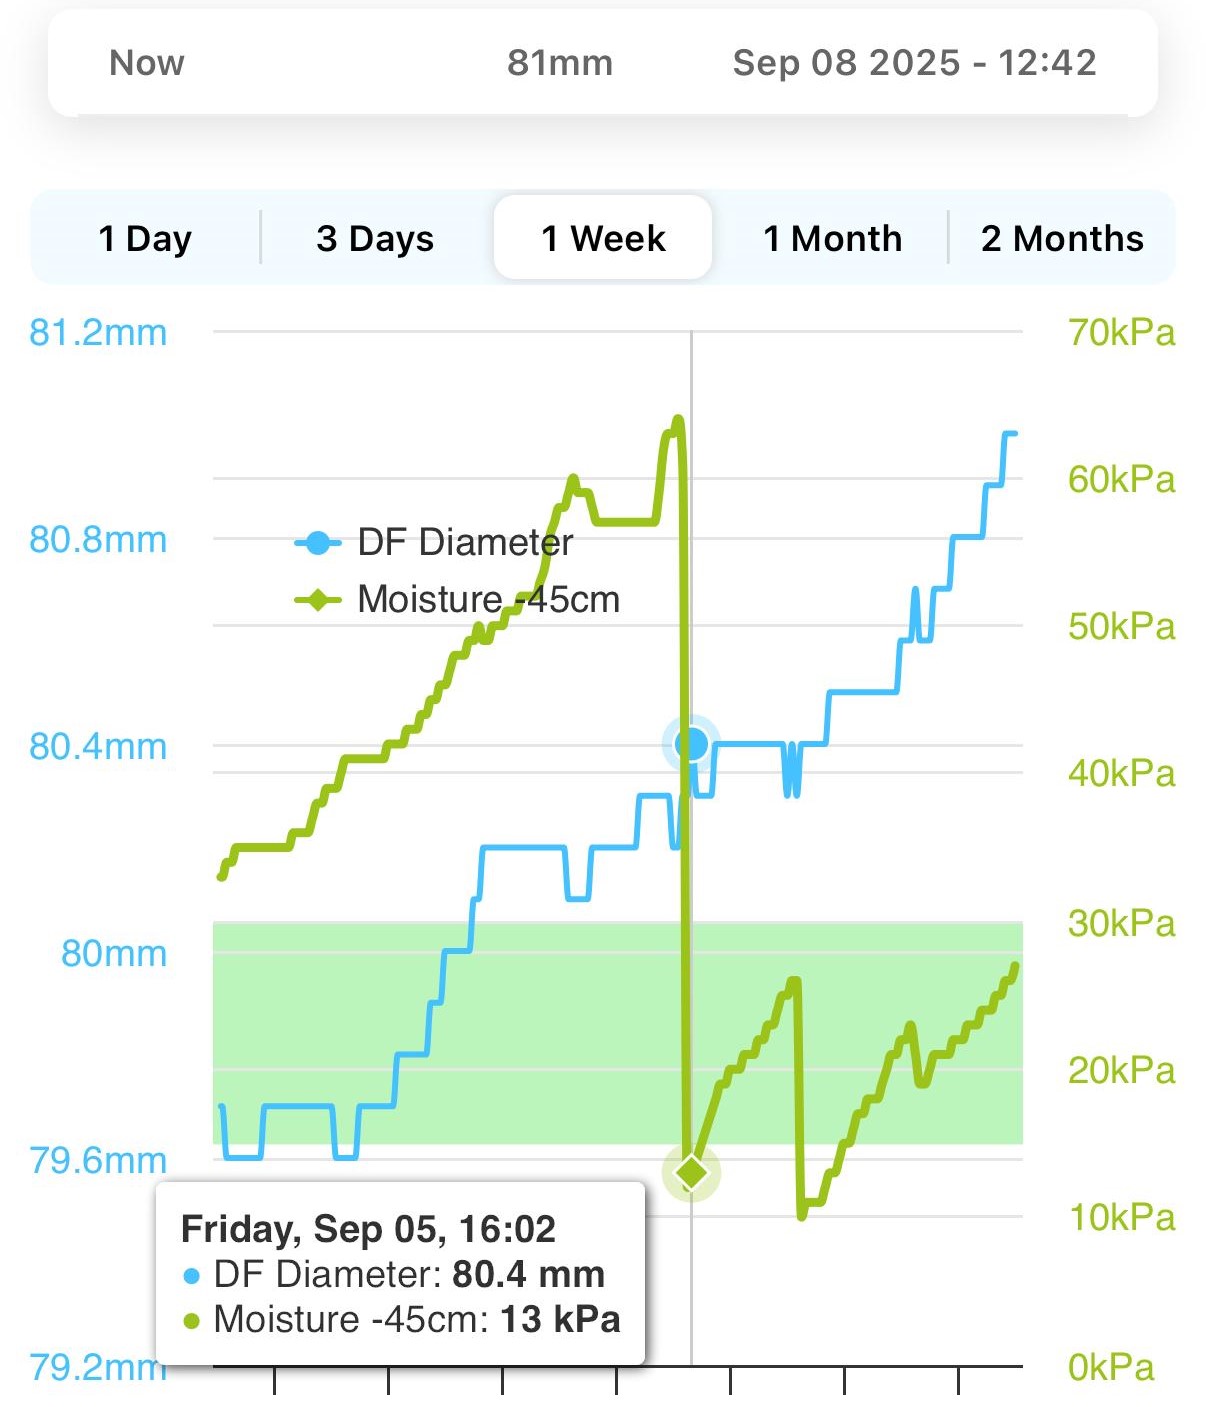
Looking at the growth curves, growth levels off sharply everywhere from the end of August. Where the pears were still 40 mm at the end of June, they are now reaching 74 to 81 mm. In the last ten days, often only half a millimetre was added. This is no coincidence: shorter days, cooler nights and the natural shift from cell division to ripening mean the “elastic goes out of the growth”.
Regional differences
Still, we see clear differences between the regions:
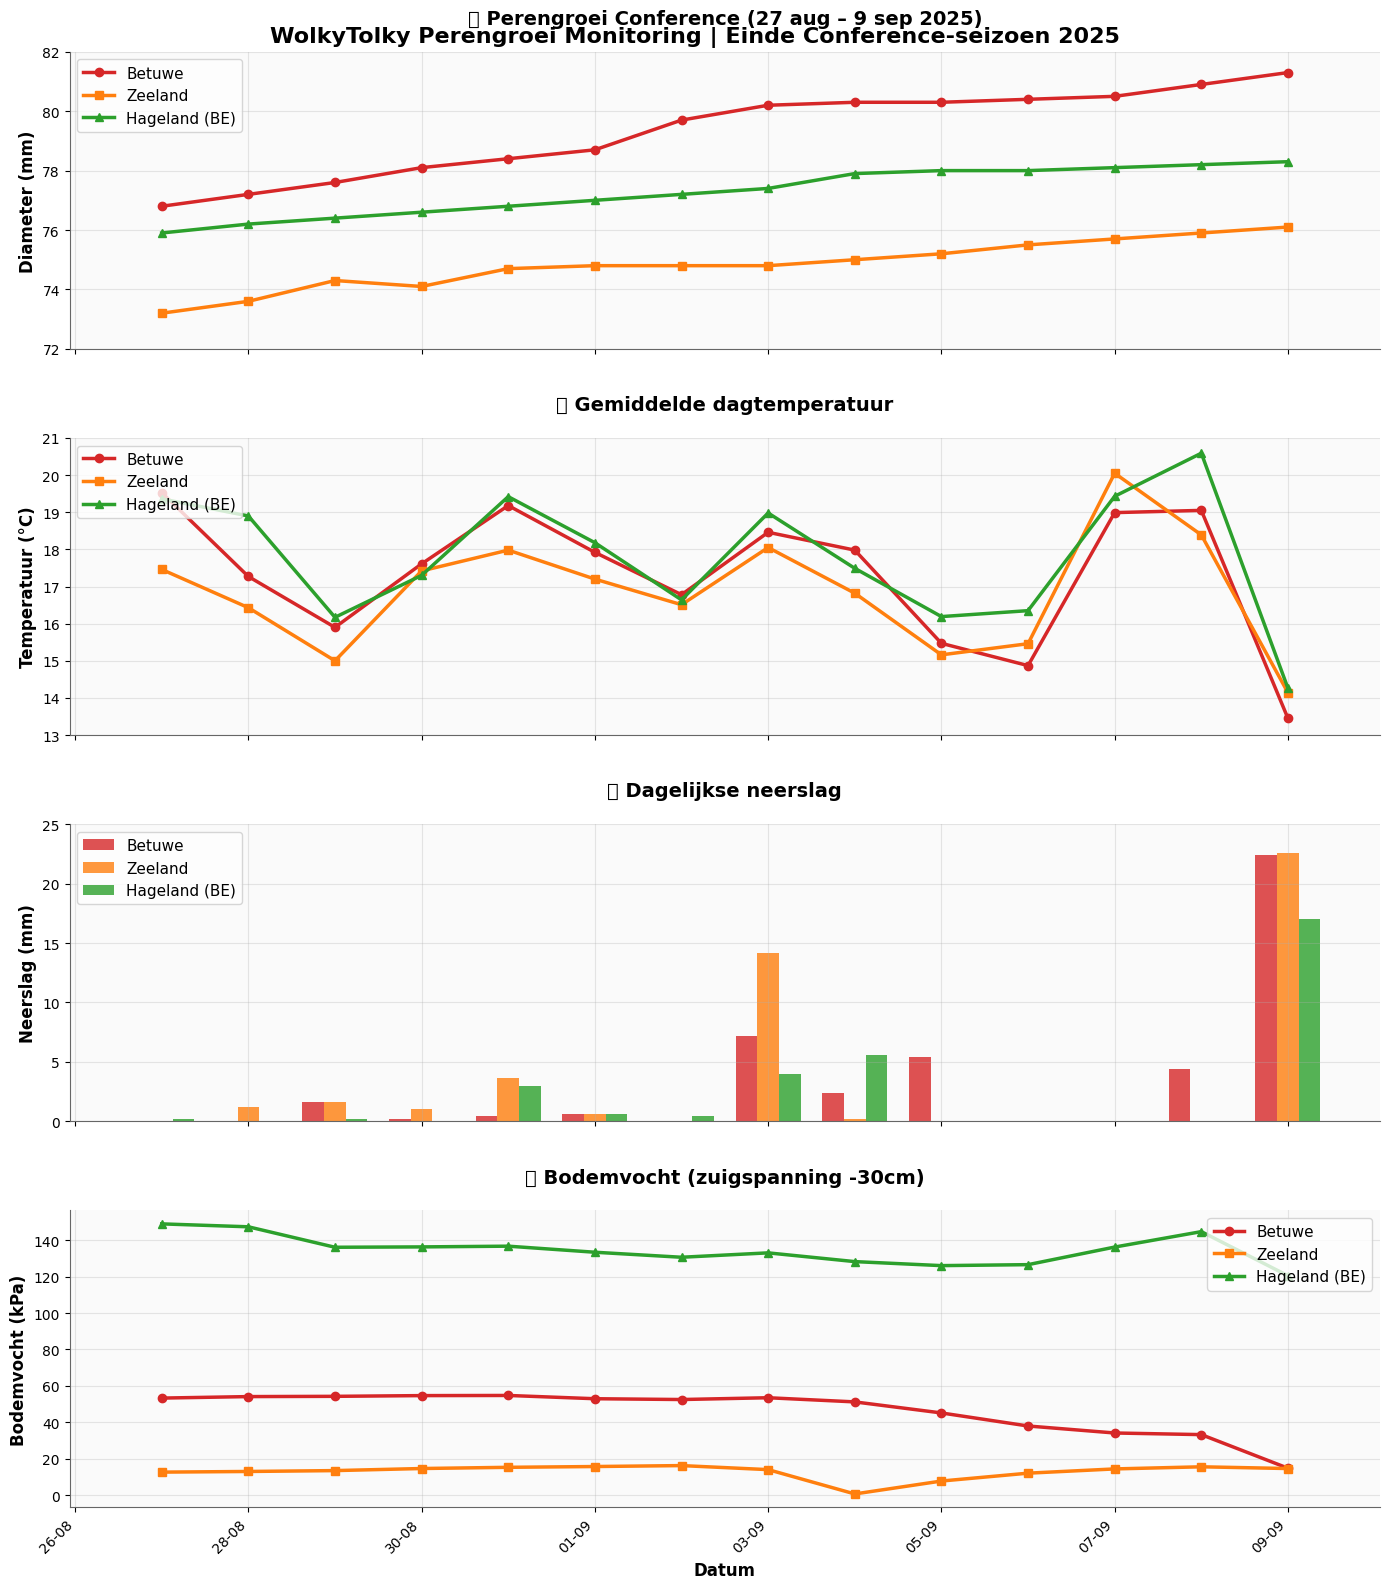
- Betuwe: the pears grew to the largest sizes (81 mm). The combination of enough water and mild temperatures helped there.
- Zeeland: lagged behind (74 mm). Cooler conditions and many wet days held back growth in the final phase.
- Hageland (BE): experienced drought stress (soil tensions above 120 kPa), which slowed growth early. Final size around 76 mm.
- Haspengouw and North Holland: stayed around the season average of 77 mm
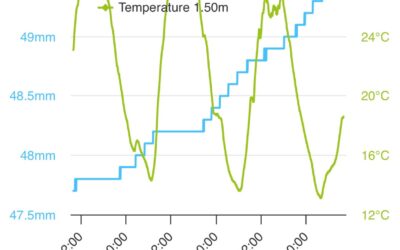
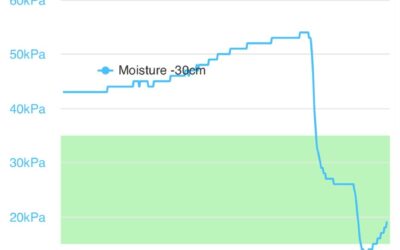
Climate data for the last 14 days
We are just before the last picking day for Conference. As a taste of what is possible when analysing data, here are some interesting figures from the last 14 days.
Why this matters
What stands out: the cause of the levelling off differs per region. In Zeeland it was too wet, in Hageland too dry, in the Betuwe perfectly in balance. That shows how important it is to measure and understand local data. Not just to record, but above all to back up decisions: fertilisation, irrigation, picking moment.
**🌐**WolkyTolky: more than measuring
Our dendrometers and WolkyTolky systems help growers not only follow the growth line, but also get the explanation that goes with it. By combining growth data with weather and soil moisture, you see exactly why pears stand still or still gain a few millimetres.
With this season we close our weekly updates. Later this year, a detailed season report will follow together with our partner growers. For now: good luck with the picking and thanks for following along!
These observations are based on dendrometer data from North Holland, Betuwe, Zeeland, Hageland and Haspengouw. More research is needed to determine practical applicability.