In this article
Weekly pear growth update – live measured with WolkyTolky dendrometers
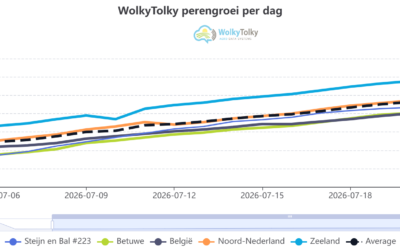
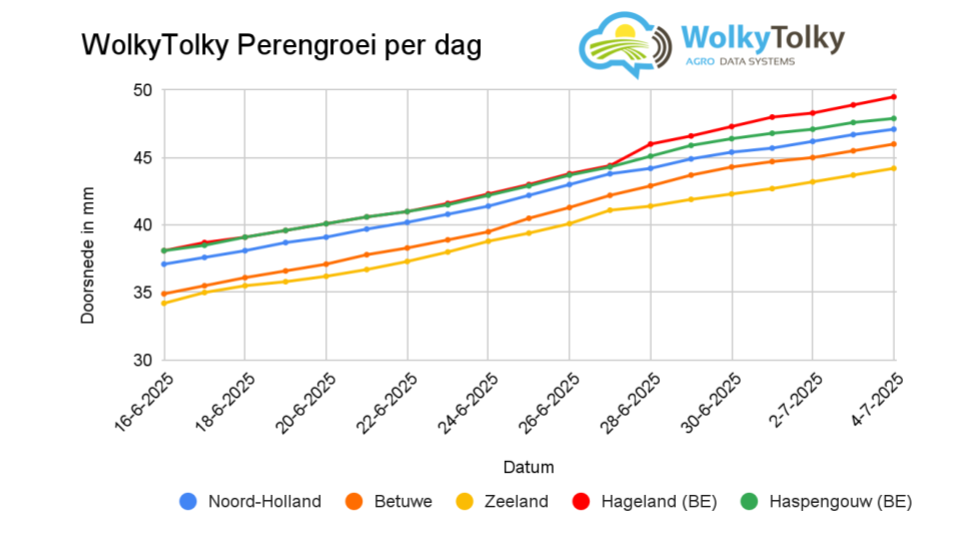
Last week there were no extreme weather conditions in the five fruit regions. Yet the pear growth curves show clear differences. The WolkyTolky dendrometers, linked to the DF sensors, record the diameter of the fruit daily. This gives us an objective picture of growth dynamics in North Holland, Betuwe, Zeeland, Hageland and Haspengouw.
Hageland: explosive growth, no stress
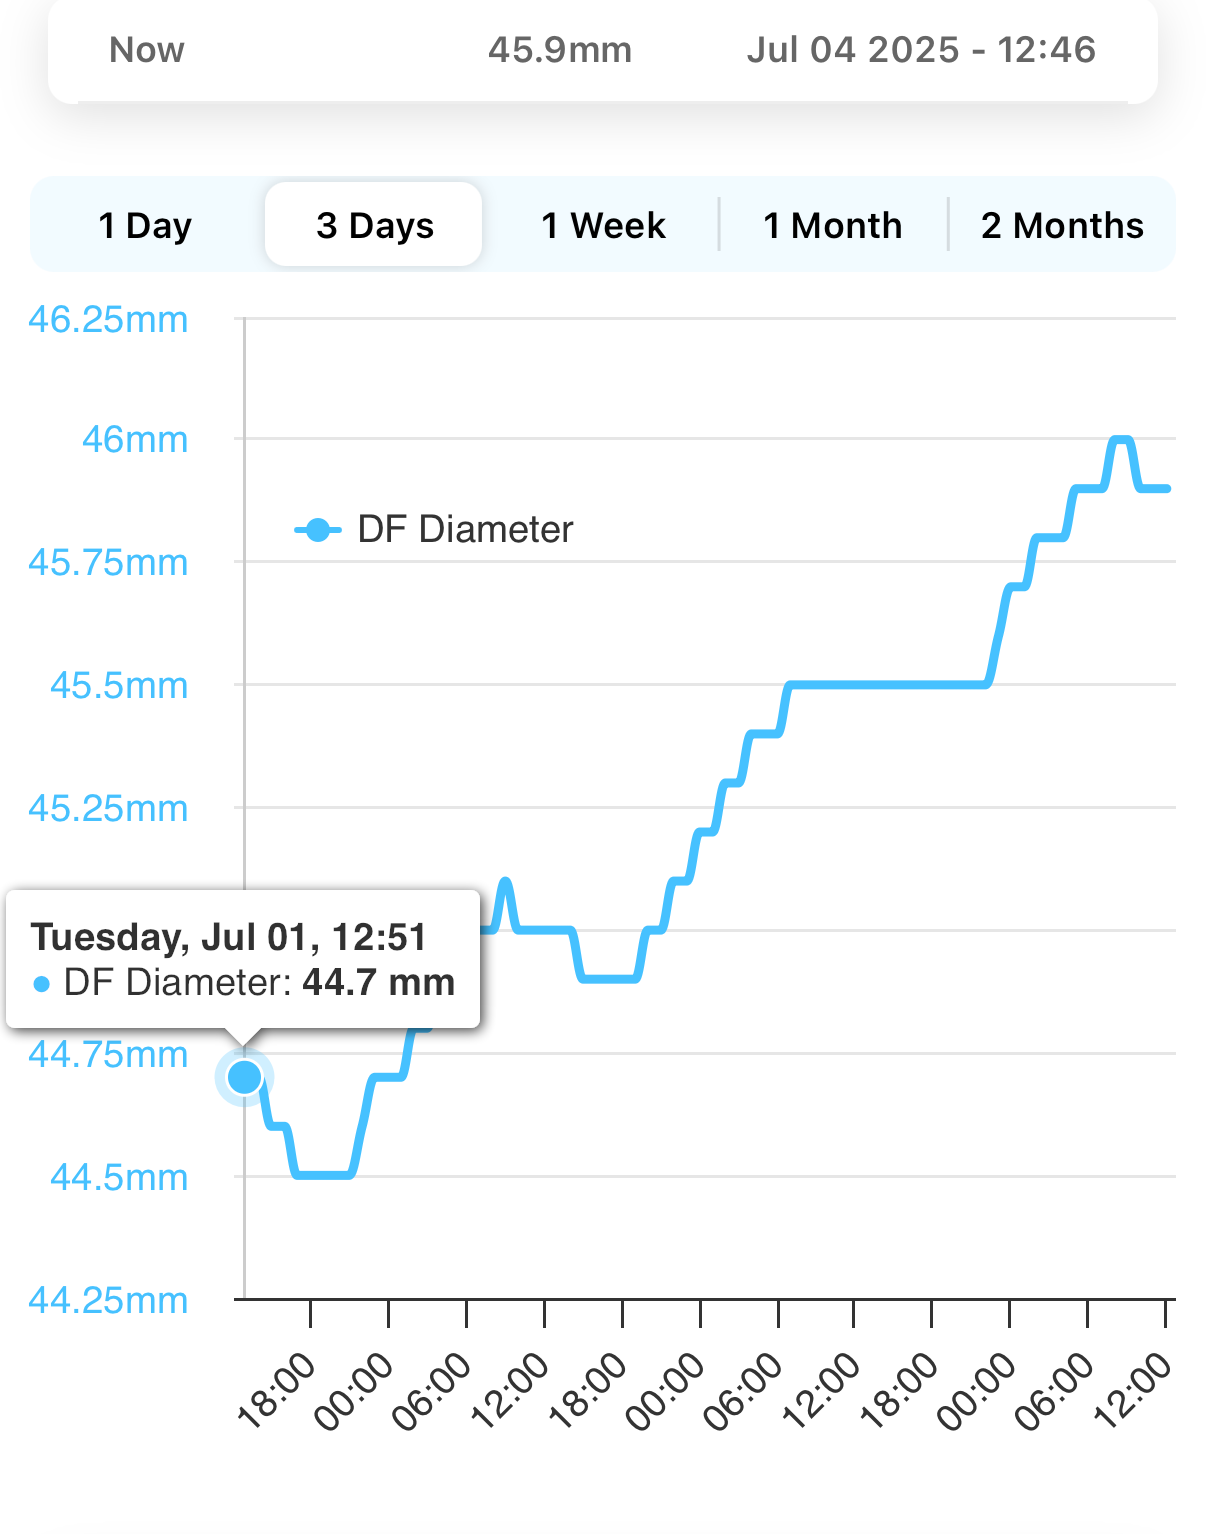
The most striking development this week is in Hageland (BE). Here the DF diameter rose from 49.0 mm to 55.4 mm in just seven days – an increase of more than 6 mm. The growth curve is almost linear, without any notable dips or stagnation. This points to optimal conditions: enough soil moisture, no heat stress and an active sap flow. The nights were relatively cool, which favours cell elongation. Notably, growth in Hageland even speeds up slightly towards the end of the week, possibly due to a combination of rainfall and high radiation.
Haspengouw: stable growth, slightly behind Hageland
Growth is also strong in Haspengouw (BE), with an increase of approximately 5 mm. The curve is slightly flatter than in Hageland, but shows no signs of stress. The pears here are on schedule for an above-average size, as long as conditions stay favourable.
Zeeland and North Holland: even growth, no outliers
In Zeeland and North Holland, growth is stable, with an increase of about 4 mm. The growth curves are flatter than in Belgium, but show no shrinkage or growth stall. This points to good water availability and mild temperatures. In Zeeland, the sea wind can cause extra evaporation, but this does not seem to be a limiting factor this week.
Betuwe: growth lags behind, points of attention
The Betuwe clearly lags behind this week. The DF diameter rises by only 2.5 mm. The curve is flat and even shows a slight levelling off halfway through the week. Possible causes are a lower soil moisture reserve, less rainfall or a limiting factor in nutrition. For growers in this region, it is advisable to monitor soil moisture and nutrient availability critically. A growth deficit at this stage is hard to make up.
No shrinkage, but regional spread
Unlike the heat wave of last week, there is no shrinkage this week. All regions show a positive growth curve. The spread between the regions is increasing, though: the difference between Hageland and Betuwe is now more than 7 mm. This underlines the importance of local monitoring and tailored crop management.
Why real-time measuring pays off
The differences between regions are bigger this week than ever. Only with objective, daily data can you adjust in time and prevent yield loss. The WolkyTolky dendrometer makes it possible to spot growth stress immediately and act in a targeted way.
Questions? We’re happy to help!
Want to know more about these measurements, the possibilities of WolkyTolky, or do you have other questions? Then go to our contact page for more information or to get in touch right away. We’re happy to think along with you!