In this article
Pear growth update week 29: Hageland pulls further ahead, differences between regions grow
Summer is in full swing, and you can see it in the pear orchards! With our WolkyTolky systems and the Ecomatik dendrometers, we measure the growth of pears daily in five important fruit regions: North Holland, Betuwe, Zeeland, Hageland (BE) and Haspengouw (BE). Time for a new update: how are the pears growing in week 29, and what stands out when we look at the longer period?
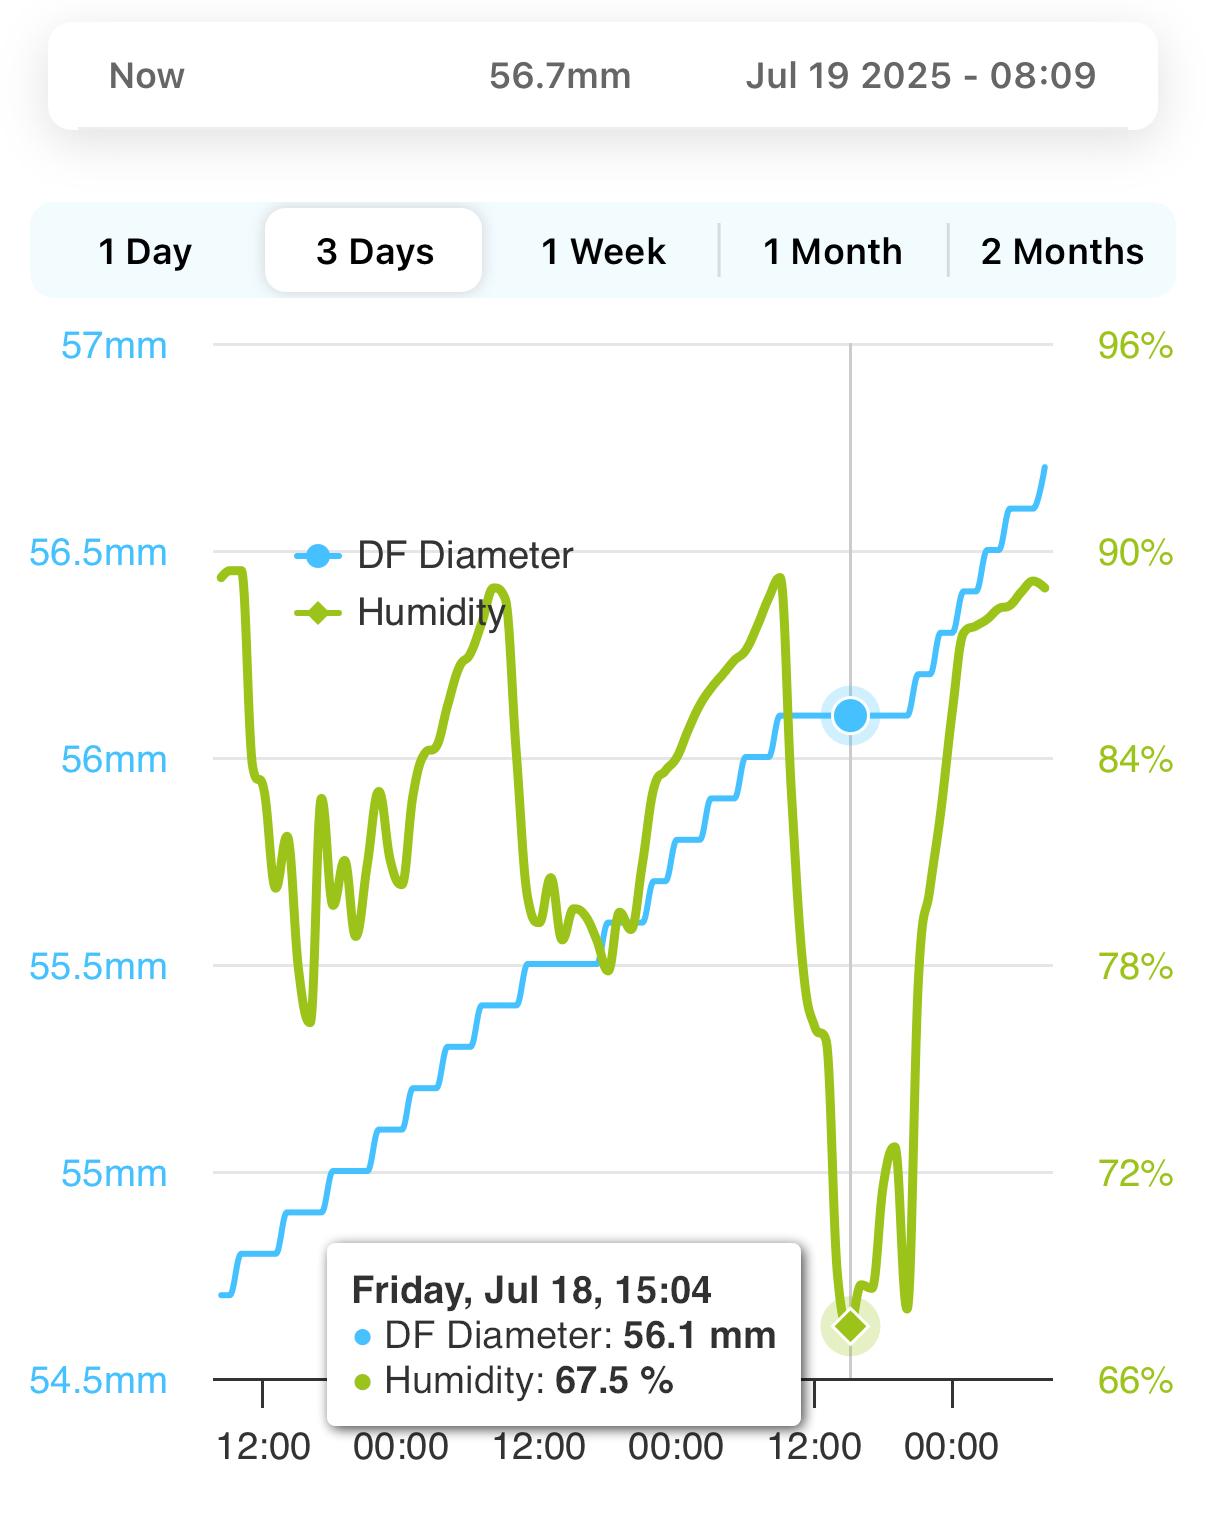
Alongside the text you see a recent measurement from the WolkyTolky app, in which the growth of a pear and the relative humidity in the orchard are tracked closely. It is notable that around 18 July the growth of the pear diameter temporarily stalls: the blue line runs flat, while the green line shows that the relative humidity drops sharply at that moment, to below 70%. This suggests that during this dry period the pear loses more moisture than it takes up, so growth briefly comes to a halt. As soon as the relative humidity rises again, the diameter recovers and growth continues. This measurement clearly shows how directly fruit growth responds to fluctuations in the orchard’s microclimate.
Average growth and spread
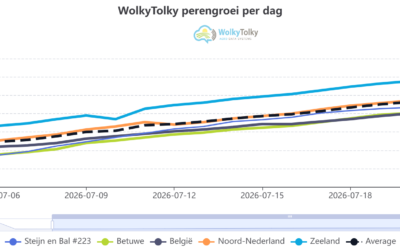
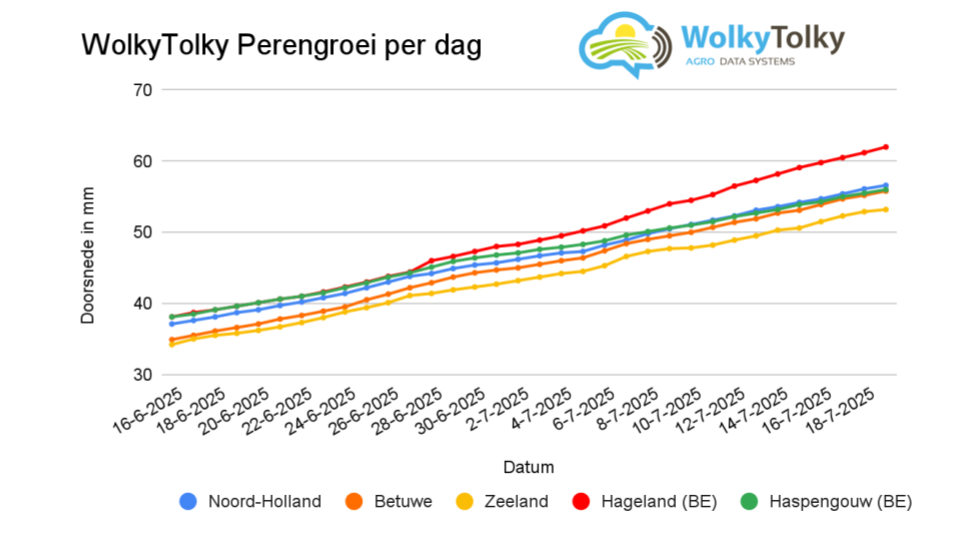
Since mid-June, the average growth of the pear diameter in the five regions is about 20 mm, with a spread of 18 to 23 mm. Most regions started at around 36-39 mm and are now between 54 and 62 mm. Hageland (BE) shows the largest increase, while the Betuwe stays structurally below the average.
To show the differences between the regions, the average growth per day is shown below, together with the growth percentage relative to the Betuwe (the region with the lowest growth, taken as 100%):
| Region | Start diameter (mm) | End diameter (mm) | Average growth per day (mm) | Growth relative to Betuwe (%) |
|---|---|---|---|---|
| North Holland | 38 | 57 | 0.59 | 105% |
| Betuwe | 36 | 54 | 0.56 | 100% |
| Zeeland | 37 | 56 | 0.59 | 105% |
| Hageland (BE) | 39 | 62 | 0.72 | 129% |
| Haspengouw (BE) | 38 | 59 | 0.66 | 118% |
Outliers and deviations
Hageland (BE) stands out with a clear acceleration in growth since early July, which means this region is now about 5 mm ahead of the rest. Haspengouw (BE) follows, with a slightly less steep growth curve. Zeeland and North Holland move fairly level, while the Betuwe lags behind throughout the whole measuring period. Zeeland shows a slight catch-up after 10 July.
Striking growth moments and the weather
Around 26-30 June, an acceleration in growth is visible in all regions, which coincides with a period of moderate temperatures and a few showers. A warm, sunny period follows in early July. It is notable that this is exactly when Hageland (BE) accelerates, possibly due to a combination of warmth and enough water. After 10 July, growth levels off in most regions, except in Hageland (BE) and Zeeland, where the growth lines actually become steeper.
Factual conclusion
The week 29 growth data show that the differences between the regions are increasing. Hageland (BE) pulls ahead, the Betuwe lags behind and Zeeland shows a recovery after an earlier deficit. The growth curves show clear responses to weather changes, particularly around the end of June and the start of July. The data underline the importance of local conditions and weather influences on fruit growth.
Questions? We’re happy to help!
Want to know more about these measurements, the possibilities of WolkyTolky, or do you have other questions? Then go to our contact page for more information or to get in touch right away. We’re happy to think along with you!