In this article
How does a pear develop over the season? What influence do the weather, the soil and crop management have on growth? And how do the different fruit regions in the Netherlands and Belgium compare? These are the questions we set out to answer. Because at a time when precision agriculture and data-driven growing are becoming more and more important, it is essential to be able to steer not just on gut feeling, but on facts.
Why measure pear growth?
For many growers, the growth pattern of their pears is a key point of attention. After all, growth determines not only the final fruit size and yield, but also affects quality, storability and the optimal harvest moment. Still, it is hard to follow pear growth well: the differences are often small, and with the naked eye you only see late whether a fruit is lagging behind or ahead. By measuring daily, growers get much faster insight into growth accelerations or slowdowns, and can adjust in time where needed.
What exactly do we measure, and how?
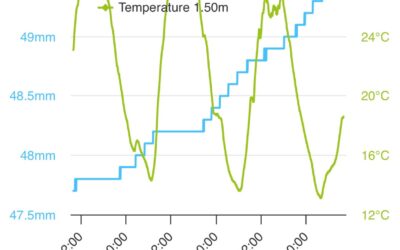
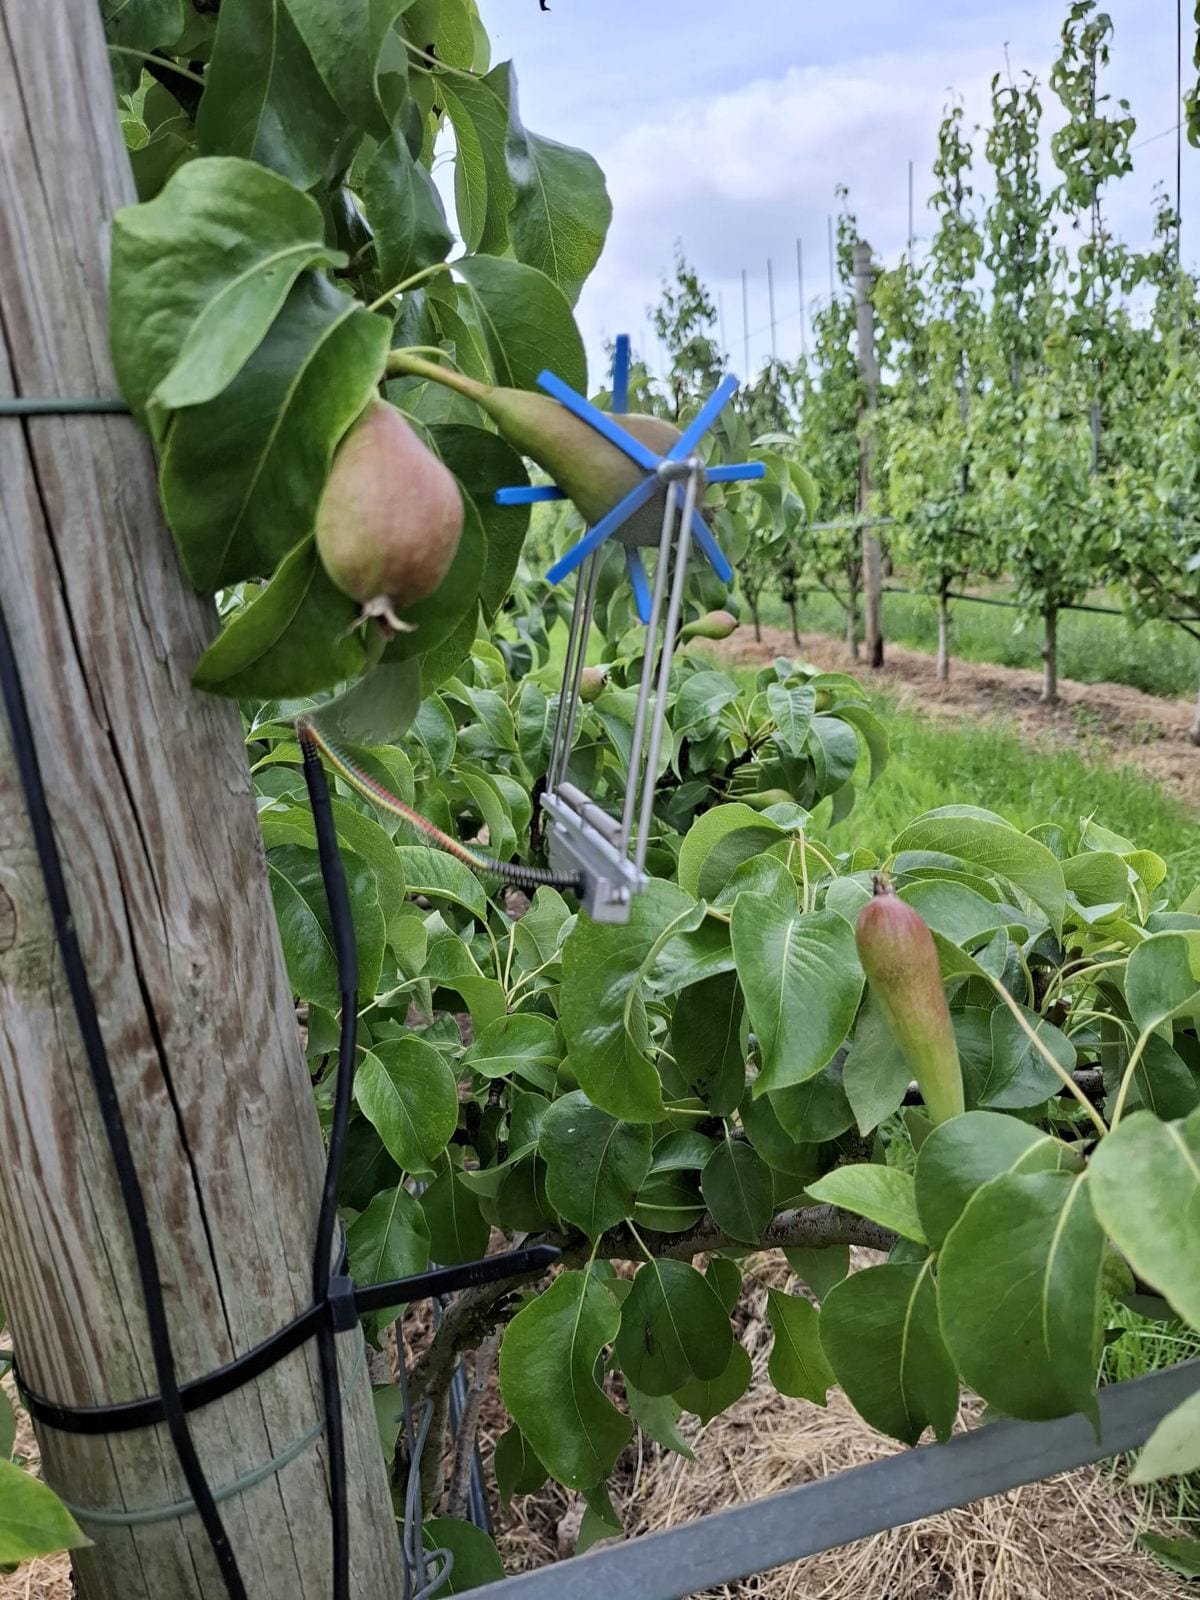
This season we measure the diameter of pears daily in five leading fruit regions – North Holland, Betuwe, Zeeland, Hageland and Haspengouw. For this we use a dendrometer, an extremely accurate measuring instrument developed specially for monitoring fruit growth. The dendrometer is attached directly to the pear and continuously records the smallest changes in diameter, to within a hundredth of a millimetre.
What makes this approach unique is the link with the WolkyTolky system. The dendrometer’s measurements are sent automatically and wirelessly to an online platform, where they are immediately visible. This means we don’t depend on manual measurements or notes, but always have current, reliable data. It also makes it easy to recognise trends and patterns, both short term and long term.
The power of regional comparison
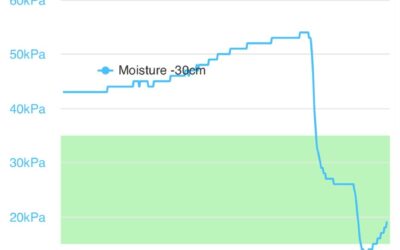
Every region has its own characteristics: climate, soil structure, water management and growing methods sometimes differ considerably. By carrying out exactly the same measurements in five different regions, we can map these differences objectively. For example, we can see how irrigating or not irrigating in the Betuwe can have a different effect on growth than in Zeeland, or how the difference in soil moisture in Haspengouw compares to North Holland.
This regional comparison offers interesting insights for researchers and advisers, but above all for growers themselves. You can compare your own situation with that of colleagues in other regions, and so learn from each other’s experiences and results.
What do we want to make visible?
With these measurements we want to do more than just collect figures. Our aim is to really make the growth dynamics of pears visible over the season. We show how growth develops, which influences play a role, and where striking differences or trends can be seen. Think of the effect of a warm spell, a rain shower or a specific fertilisation strategy.
Every week we publish an overview of the growth figures per region, with clear graphs and an explanation of the main developments. We discuss striking growth accelerations or slowdowns, compare the regions with each other, and where possible give practical tips or points of attention for cultivation.
What do these insights mean for you as a grower?
By following the growth of your pears continuously, you can respond faster to changes. If you see, for example, that growth is lagging after a dry period, you can decide in time to irrigate extra. If you notice that growth in your region is behind other areas, you can investigate why and adjust your strategy if needed. It also helps to determine the optimal harvest moment better, which directly contributes to the quality and yield of your harvest.
Follow pear growth with us
With this blog we take growers, advisers and other interested parties along every week on the current state of pear growth in the Netherlands and Belgium. We hope these insights contribute to even better, data-driven growing. Do you have questions or want to know more about the measurements? Feel free to get in touch.
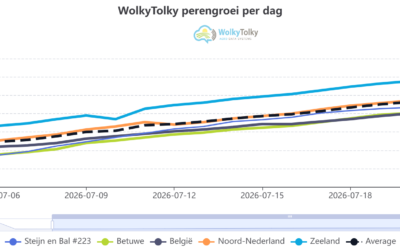
Below you will find the first graph with the daily growth of pears in the five fruit regions.
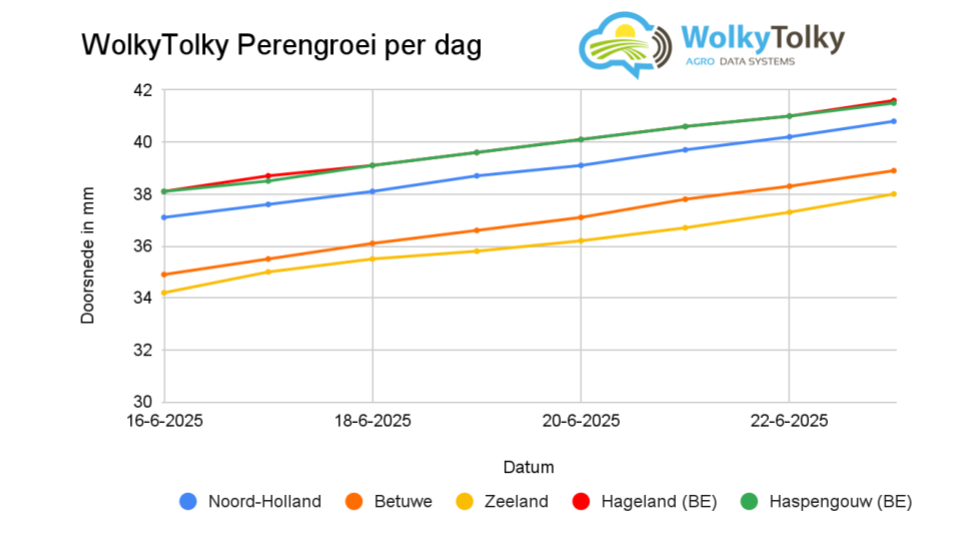
Pear growth week 25
In the period from 16 to 23 June, pear growth in all regions was remarkably even, with an increase of about 3.4 to 4.0 mm in fruit diameter. The Betuwe shows the greatest growth this week (+4.0 mm), followed by Zeeland (+3.8 mm) and North Holland (+3.7 mm). Hageland and Haspengouw grow somewhat less, but remain ahead in absolute fruit size. Zeeland is still slightly behind in absolute size, but its growth rate is comparable to the other regions.
The differences between the regions are small, which shows that pear growth this week is almost synchronous in the Netherlands and Belgium. Thanks to the daily measurements with WolkyTolky, these subtle differences and similarities are clearly visible and growers can objectively compare their own situation with other regions.
Questions? We’re happy to help!
Want to know more about these measurements, the possibilities of WolkyTolky, or do you have other questions? Then go to our contact page for more information or to get in touch right away. We’re happy to think along with you!